Traditional search tracks user interactions to learn what’s relevant. We use hovers, clicks, or purchases to learn the best search results for a query. But, what if we have no user interaction data? Imagine a future where we have very little tracking data - however anonymized and aggregated.
We’d be stuck, right? We couldn’t make progress on search relevance?
I want to share an idea to simulate what relevance labels could lead to certain experiment outcomes.
From A/B test to Relevance Judgments
Imagine that we could A/B test relevance rankings to see which wins. Could we work backwards to guess the likely relevance labels for query-document pairs?
Knowing B beats A, by some X%, could we attribute the X% to how specific search results shift between A and B? And if that shift was positive, then we could assume the search results that shifted up were more likely positive? And those that shifted down more likely than not negative? If we repeat this procedure over many A/B tests, we could get an even deeper image of which results are preferred by users.
Doesn’t quite make sense? Let’s explore an example!
Which relevance universe best explains the outcome?
If we isolate to a single query, we could see how it could be possible to reconstruct relevance labels. If we observe a ranking shift between two algorithms like below, and an accompanying lift of 5% in an add to cart metric, what does that say for this ranking change?
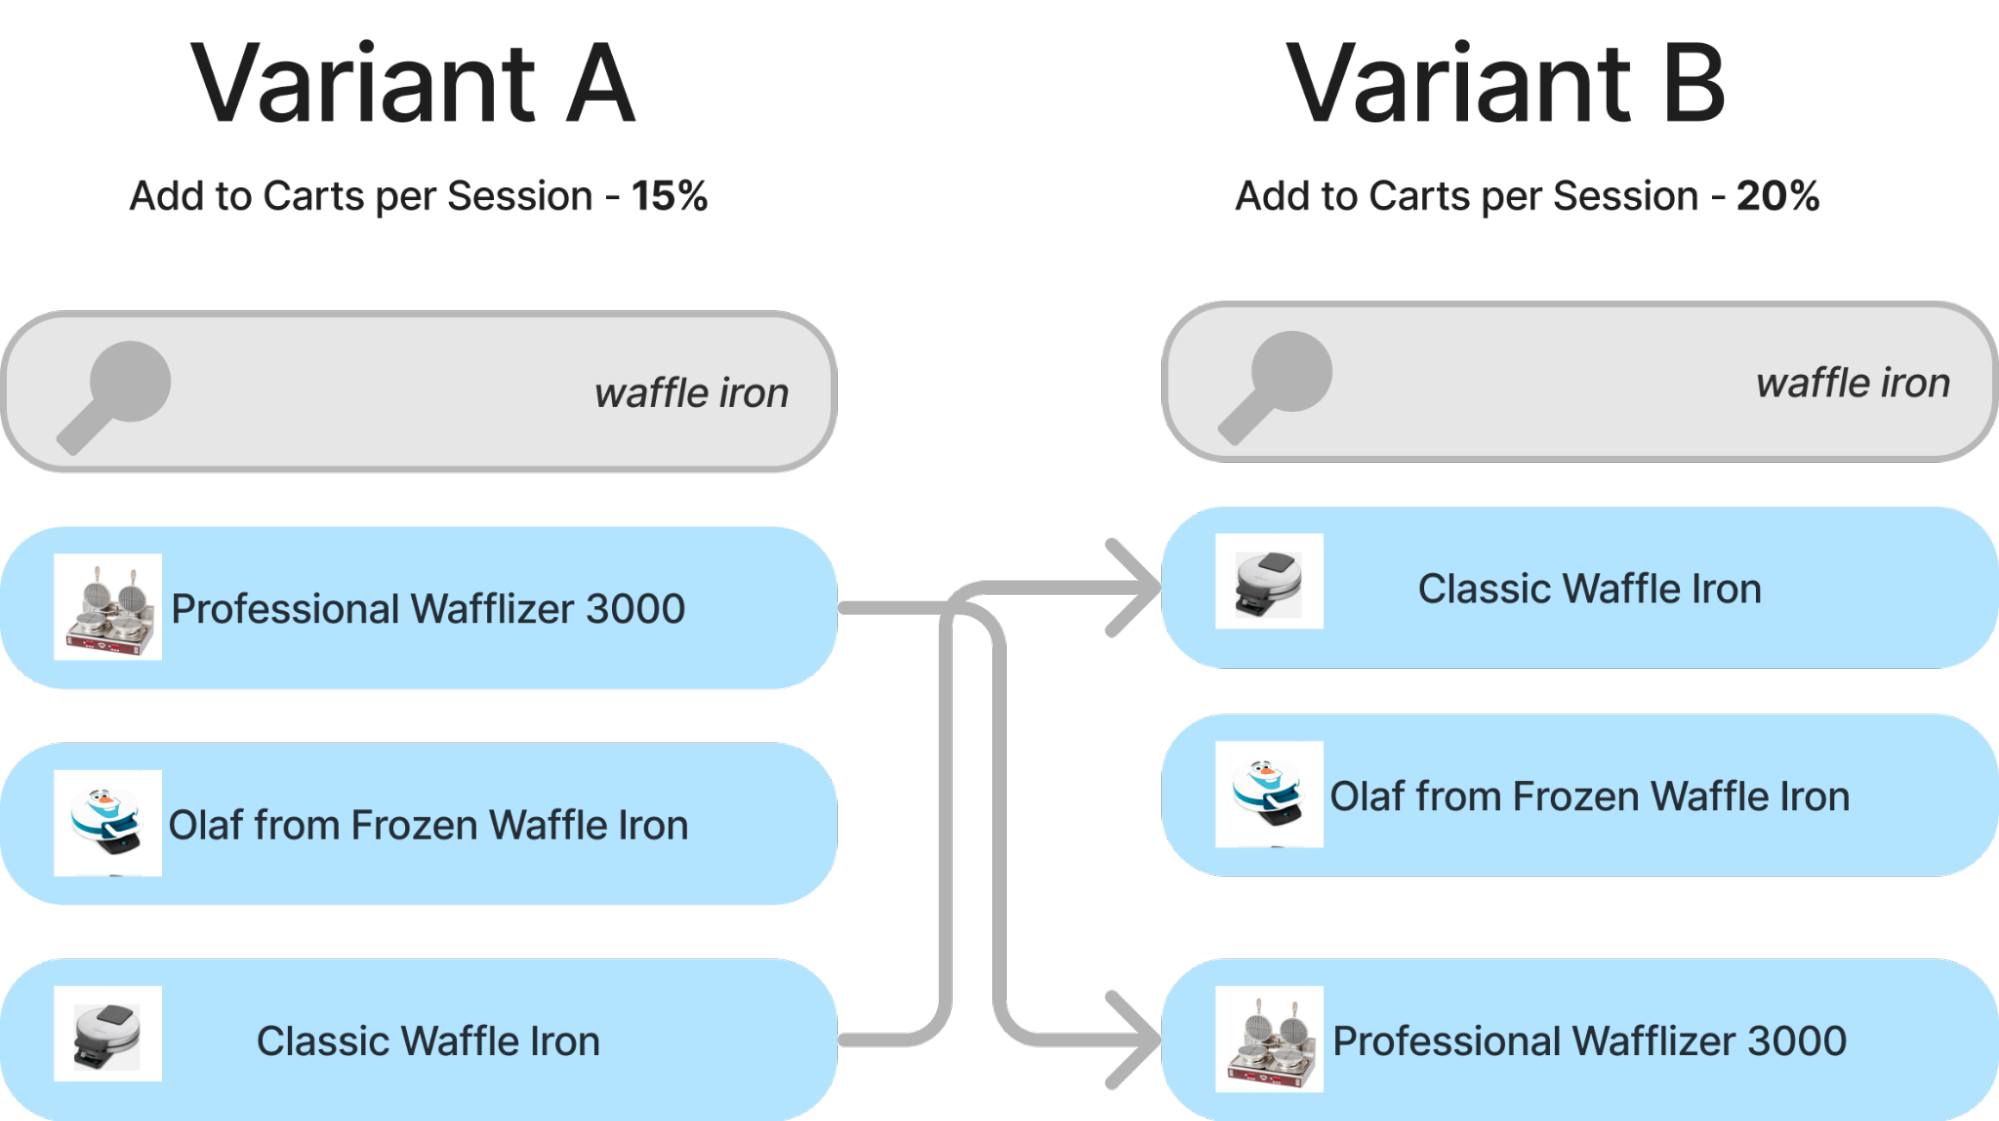
Intuitively, it probably corresponds to “classic waffle iron” being more relevant than professional “Professional Wafflizer 3000”. We’re already off to a good start!
But we can be more scientific, we can quantify what it means for a relevant result to shift ranks for our metric*. If we know a global per-position weight, we can quantify what a good or bad shift would likely do.
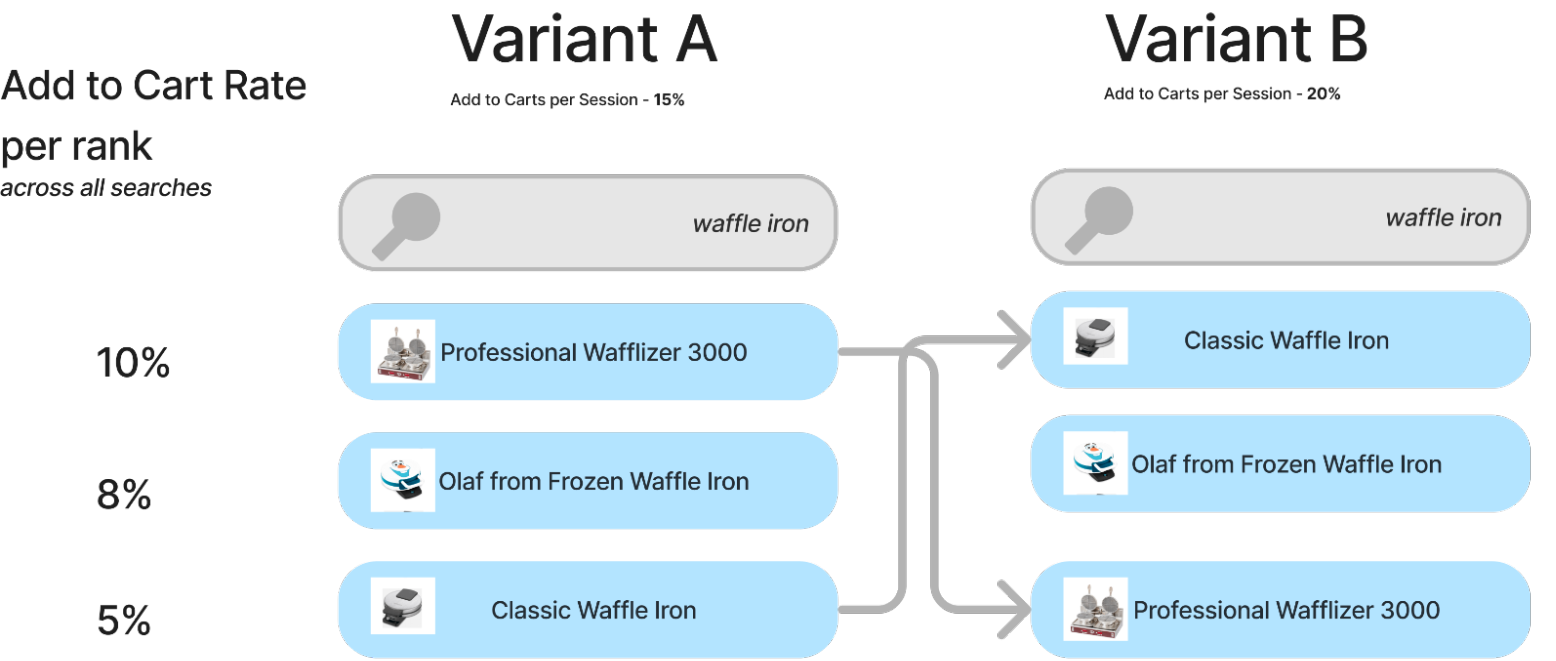
Given this model, we could assume a relevant result going from position 1->2 means losing 2% add to carts. Or in our case, a relevant result going from 3->1 means a gain of 5% add to carts for this query.
Putting all of our knowledge together:
- We’re in a universe of observing a +5% lift,
- We observe an item moving from position 3->1
Therefore…
It’s likely that Classic Waffle Iron is relevant while Professional Wafflizer is not. It corresponds to the most likely universe that explains the A/B test.
Expanding to many queries
If we expand this to multiple queries, we can create a model for the add to cart shift:
Delta ATC = weight_delta * query_doc_relevance_label + ... +
for every query, doc ranking that shifted between A and B
Where
- weight_delta is the add to cart (ATC) delta expected from a relevant item shift (known or estimated from the data) +5% for 3->1, for example.
- query_doc_relevance_label is either a 1 (relevant) or 0 (irrelevant)
Given this model, we can explore the relevance labels that likely explain the A/B test outcome. If the selected labels get very close to the observed Delta ATC, we consider this set of labels as a possible relevance universe.
Of course there are many relevance universes that explain the Delta ATC. So we can’t arrive at some perfect, objective relevance label.
Given thousands of queries - sometimes we’ll observe cases where the Wafflizer being relevant explains the data, sometimes we observe cases where it being irrelevant also explains the relevance universe. But if we observe MORE universes where it’s relevant, we would learn more that it’s likely relevant, and vice versa.
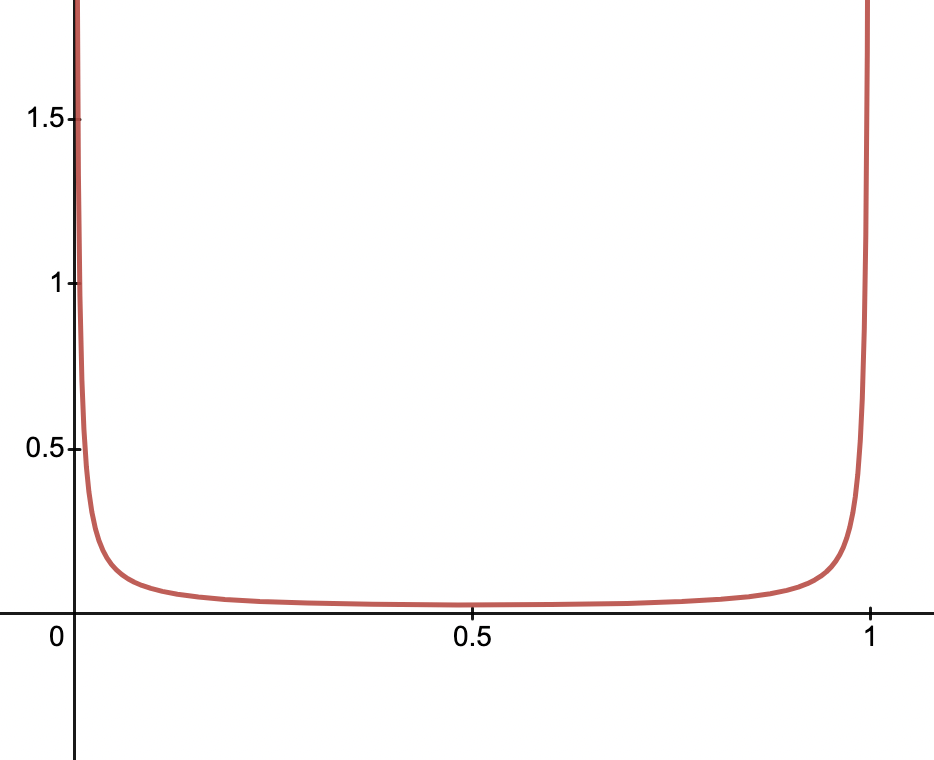
Luckily, we can track how likely a document is relevant by simply using the beta distribution. The beta distribution gives us a probability distribution of the probability itself. If 1 is certain relevance and 0 certain irrelevance, then we can quantify the probability of document relevance.
prob_query_doc_relevance = alpha / (alpha + beta)
We start with a very weak prior. We state that alpha=0.01, beta=0.01. This just means we have no idea, but most likely its 0 or 1! The probability distribution of relevance looks like:
We increment alpha by some value whenever we observe a plausible universe where the doc is relevant, and vice versa. In reality, it’s not as black and white as ‘plausible universe or not’. We can use the probability of the universe itself when we increment alpha and beta. An unlikely universe has little / no impact on the grade. More likely universes have a higher impact.
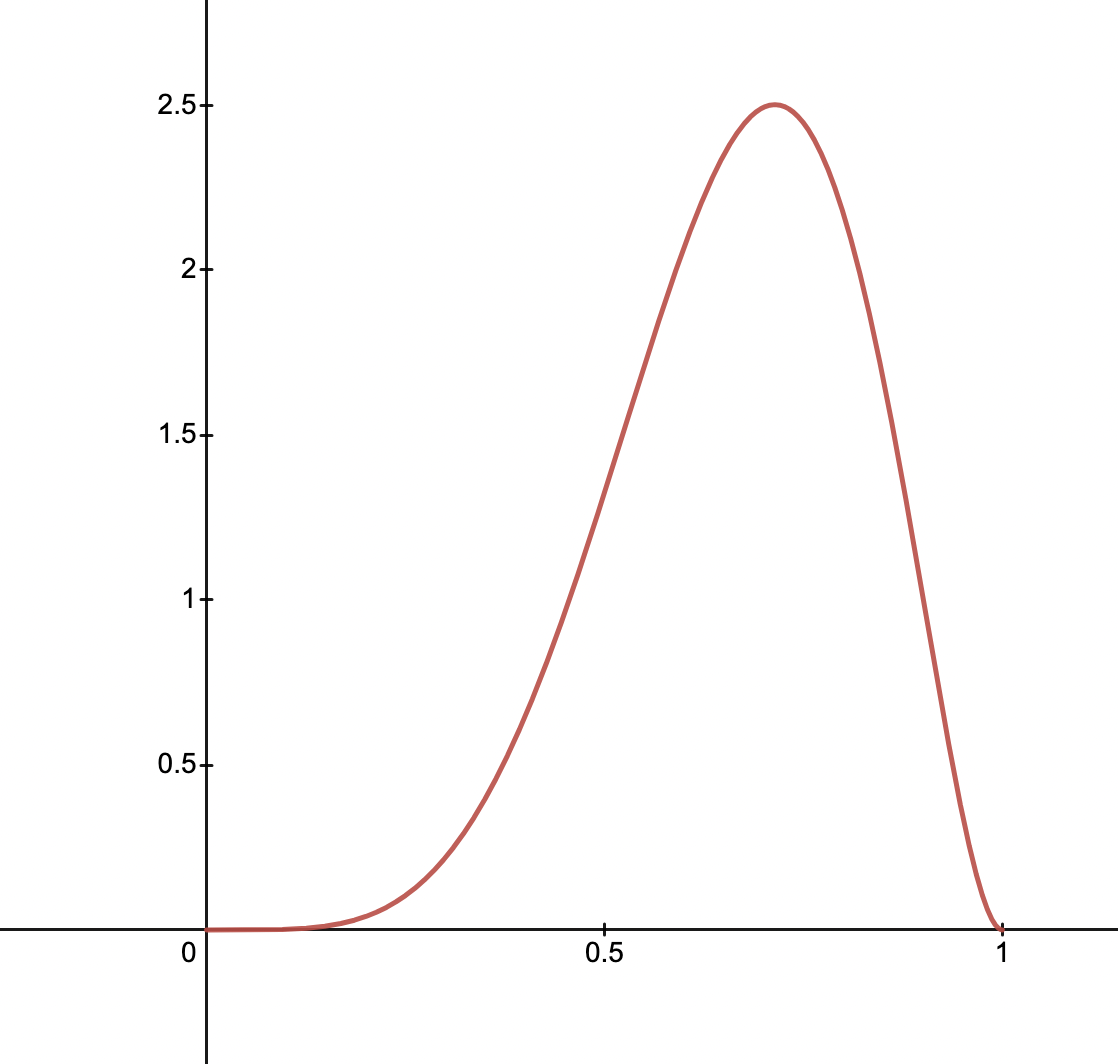
After many runs, we may observe something like, alpha=5.787, beta=2.915 for the Wafflizer. More likely than not it is relevant, as shown in the graph of below
In many ways this is similar to how a website like fivethirtyeight simulates election results. To explain a given US national poll, such a simulation has to work backwards. The poll being X% for a candidate, means it’s more likely than not a given state or electoral block of voters leans more one way or the other.
Perhaps we should always do this?
This seems like a useful practice even in the presence of user interaction data. This set of relevance labels helps us get a picture that’s tied directly to our desired outcome. So often judgment systems are put into production to train a model or directly to influence search results. They fail to influence A/B test outcomes. But if those judgments came from the A/B test themselves, then wouldn’t we be more likely to see an uplift in our desired metrics?
Does this actually work?
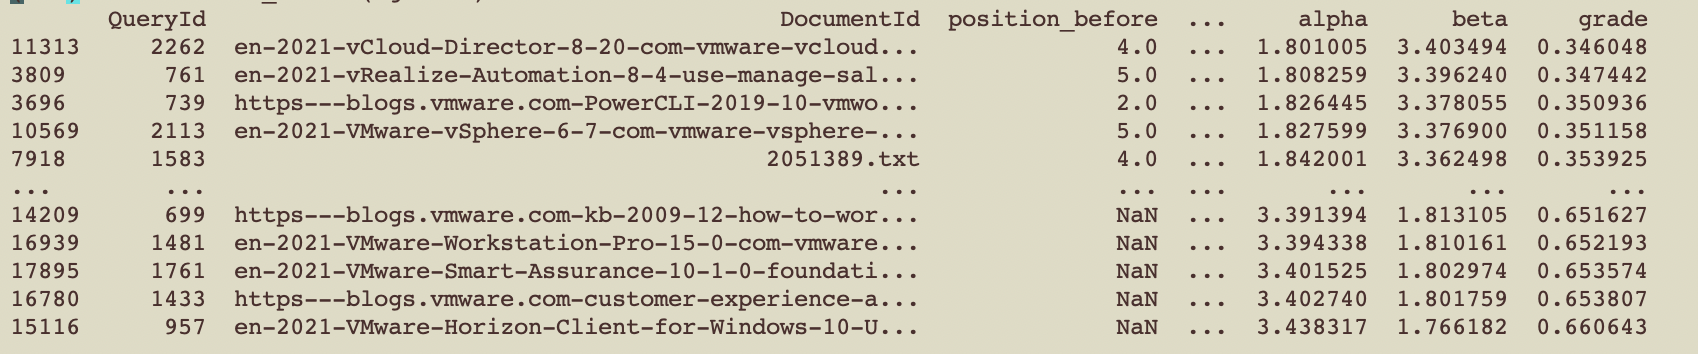
I’ve tried this method in exactly one context. The vmware zero-shot information retrieval competition. I won’t get into the weeds on the competition there, but essentially they only give you the outcome (mean NDCG) of your submission. They give you no relevance labels. The competition seeks to arrive at better methods for retrieval without labels.
What if in this context (and like the A/B test context above) we worked backwards from test runs to reverse engineer the relevance labels. I have tried to use this method to work backwards from the mean NDCG to the relevance judgments. It provides compelling results!
I’m still working to include this in my workflow, with results TBD, but so far results are promising. Check back and see whether this helped me out in the competition!
Like I said, I’m excited about this crazy idea, and am eager to here feedback, ideas, and challenges (of which its easy to think of many!). Get in touch to share your ideas :)
* This is an assumption. One of those ‘no models are correct, some are useful’. You can always develop more complex models depending on your available data
Upcoming course: Build your own vector database

Want to understand what makes embedding retrieval fast, relevant, and useful in real AI systems? Join Build your own vector database and build the core pieces yourself, from embeddings and indexing to search and retrieval.

Doug Turnbull
More from DougTwitter | LinkedIn | Newsletter | Bsky