I wrote a script to convert VisualVM’s sampling profiler output into a format suitable for flamegraphs. I find Flamegraphs more usable than VisualVM’s profiler view.
I’ll walk through an example using my local IntelliJ as a Java application. But this applies to any Java application you might be profiling with VisualVM.
Clone flamegraphs
Clone the flamegraphs repo locally. We’ll run the script there to generate a flamegraph SVG after we do our profiling.
Run VisualVM Sampling Profiler
Using VisualVM for profiling Java applications is outside the scope of this article. This blog post gives a nice overview.
As I said, I have Intellij running locally. I’ll use that as my example Java application to profile. Usually I’d place the code under stress to find a performance issue, but in this case IntelliJ will just be sitting idle.
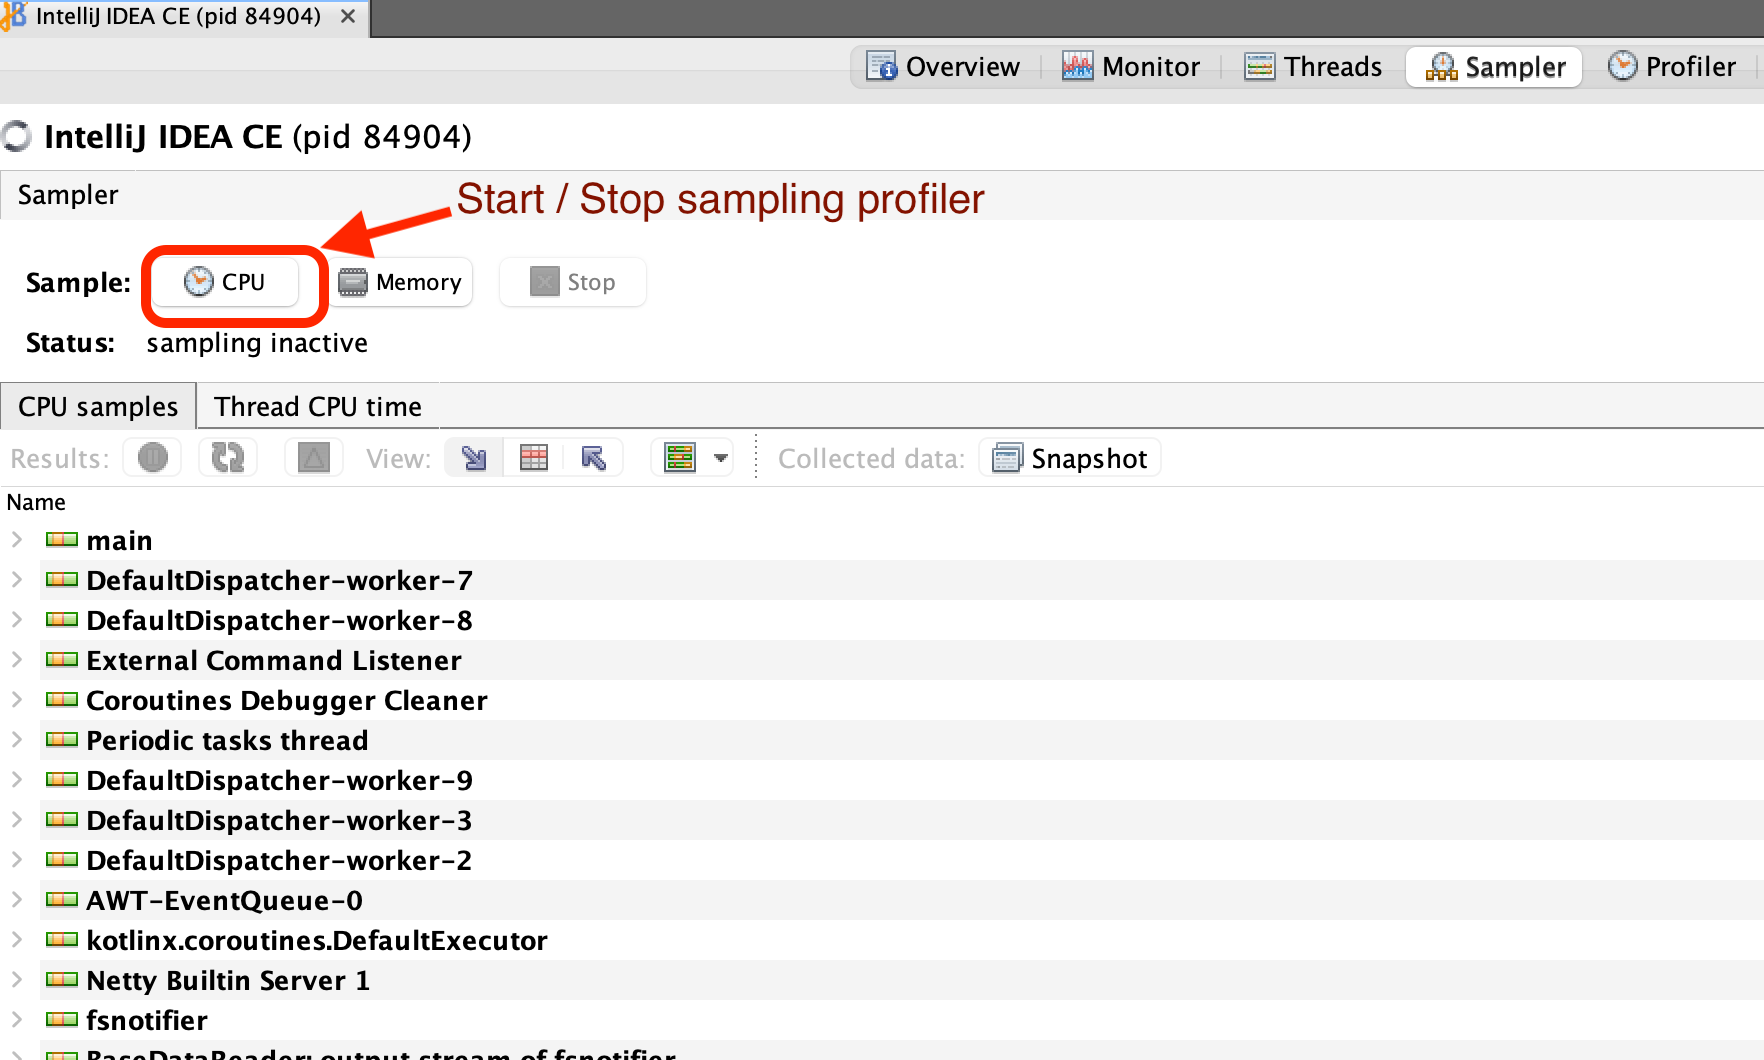
I can start / stop with just this CPU button:

Save a snapshot
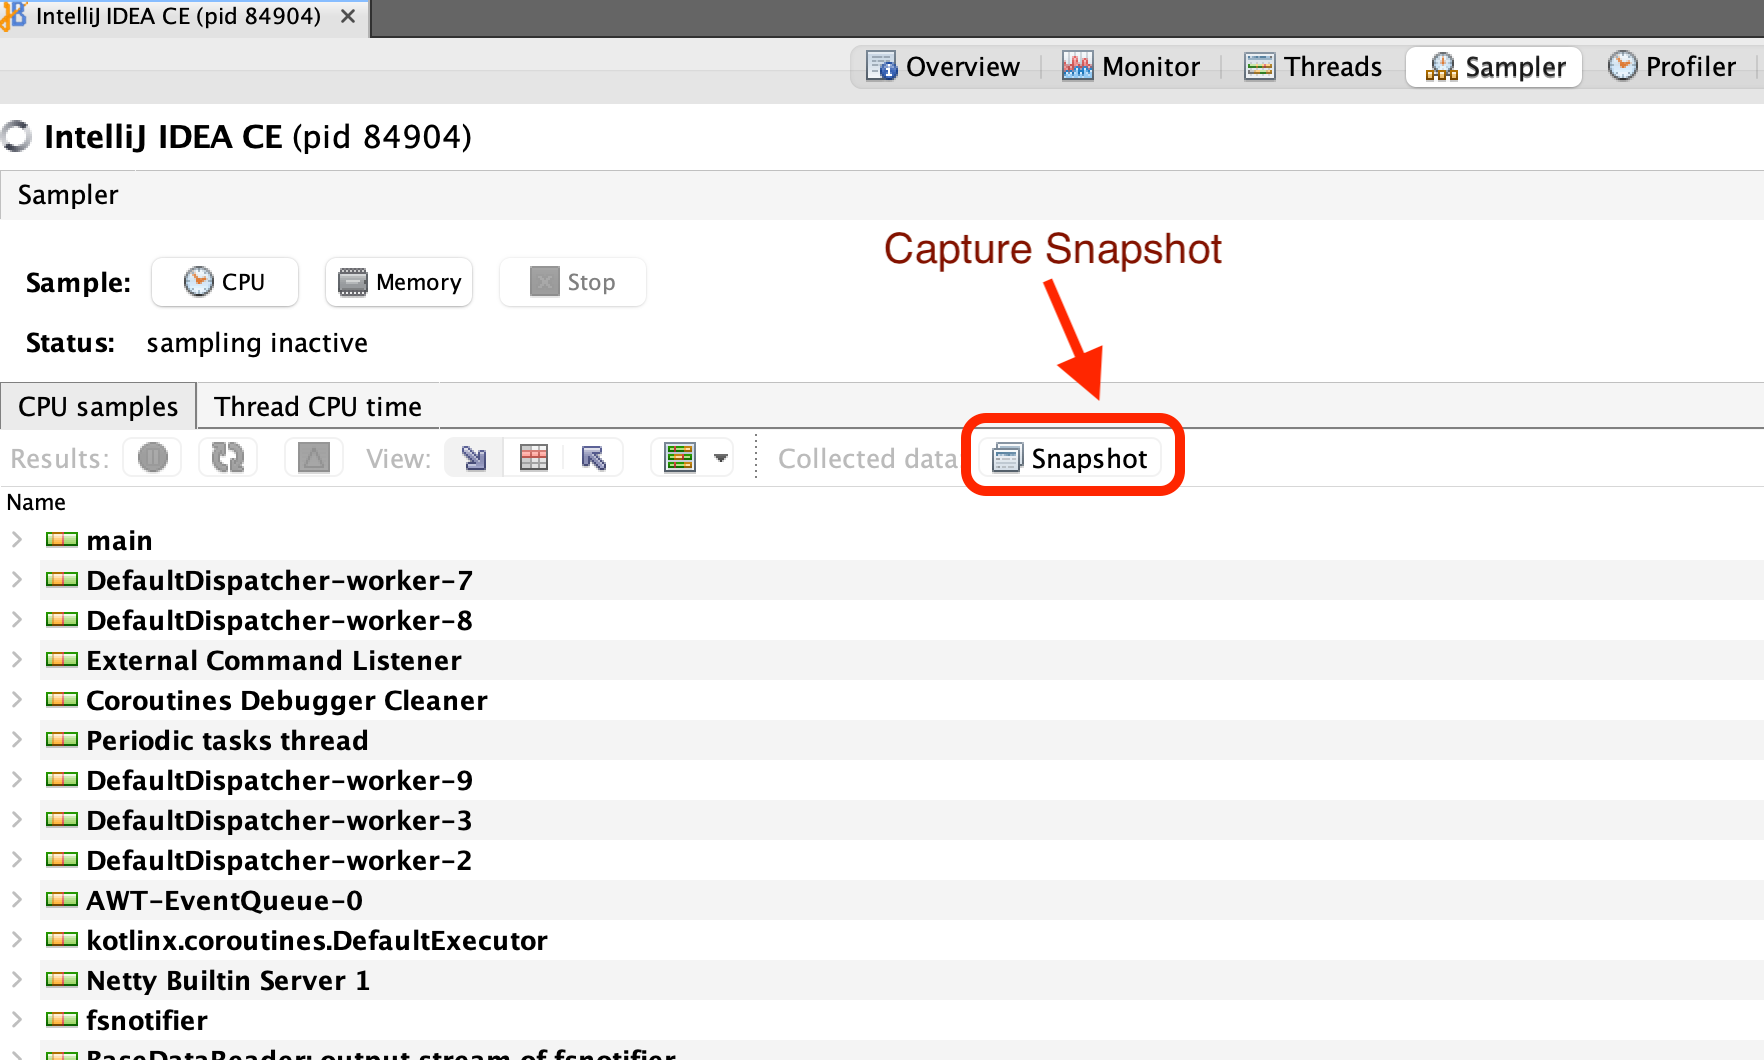
Once you’re done running the CPU profiler, save a snapshot of the IntelliJ callstacks:

Export fwd calls as CSV
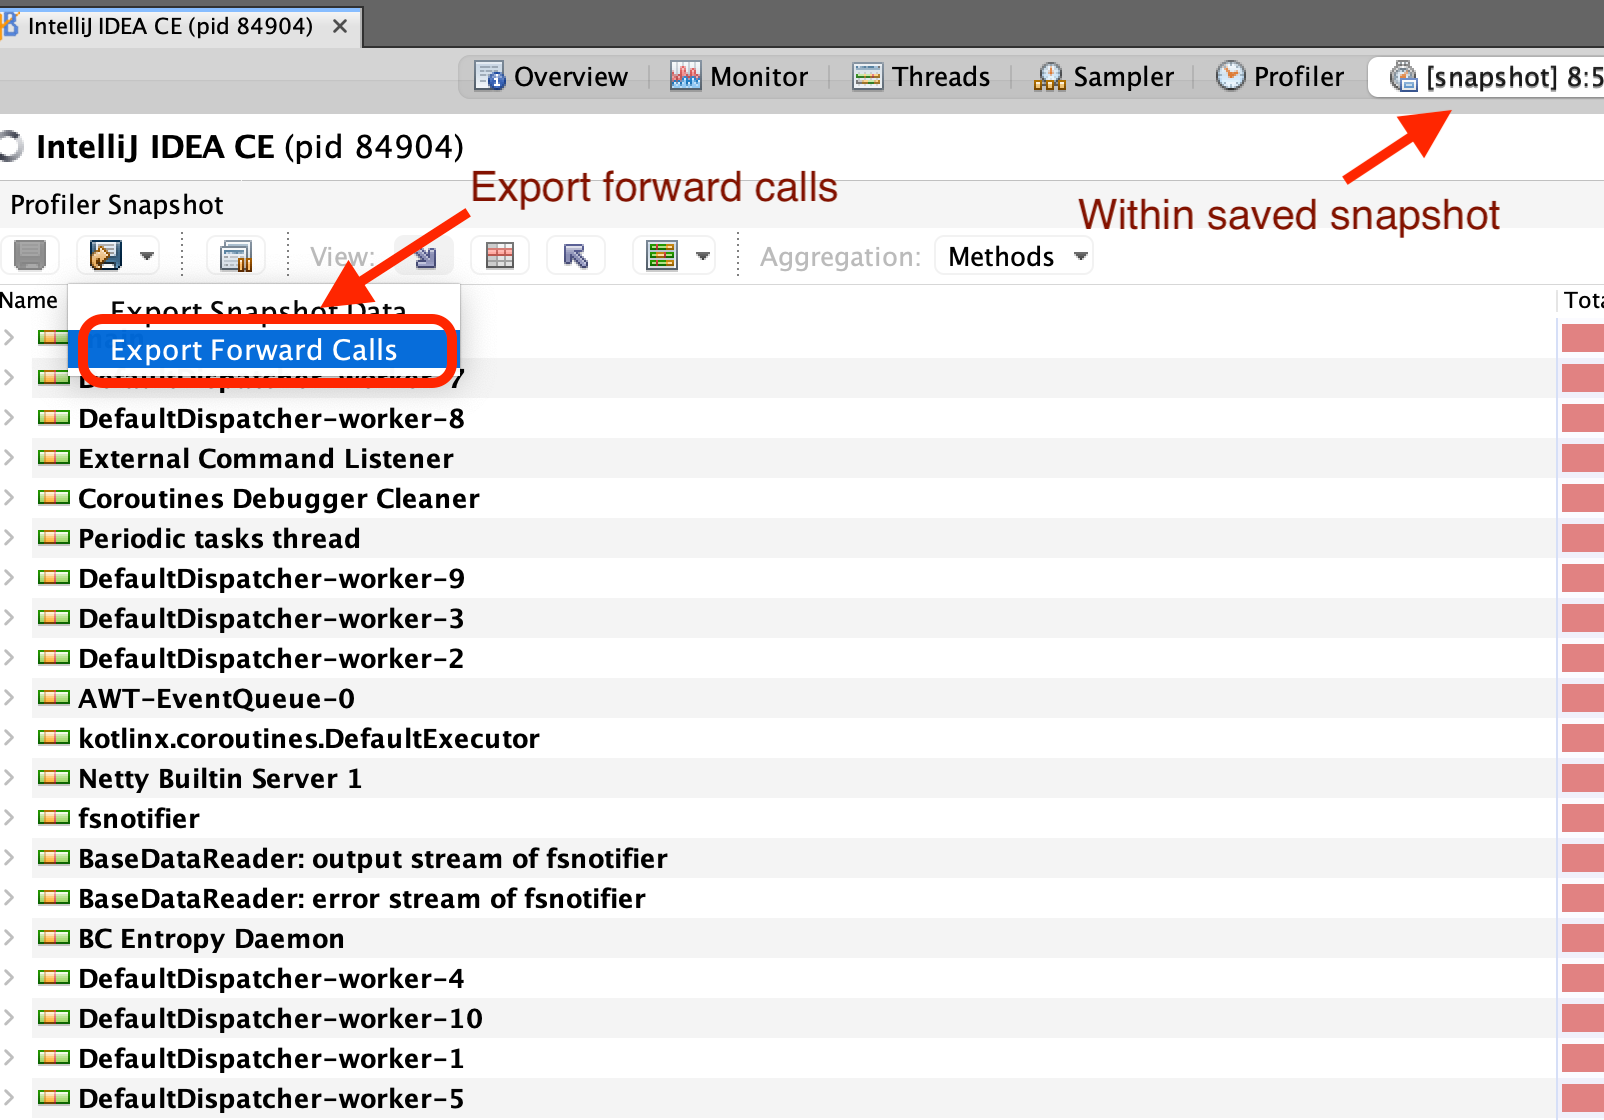
Navigate into the snapshot in VisualVM. We’ll export VisualVM’s forward calls view
The forward calls CSV contains the expanded, sampled callstacks captured during profiling. Within the snapshot, select the save icon…

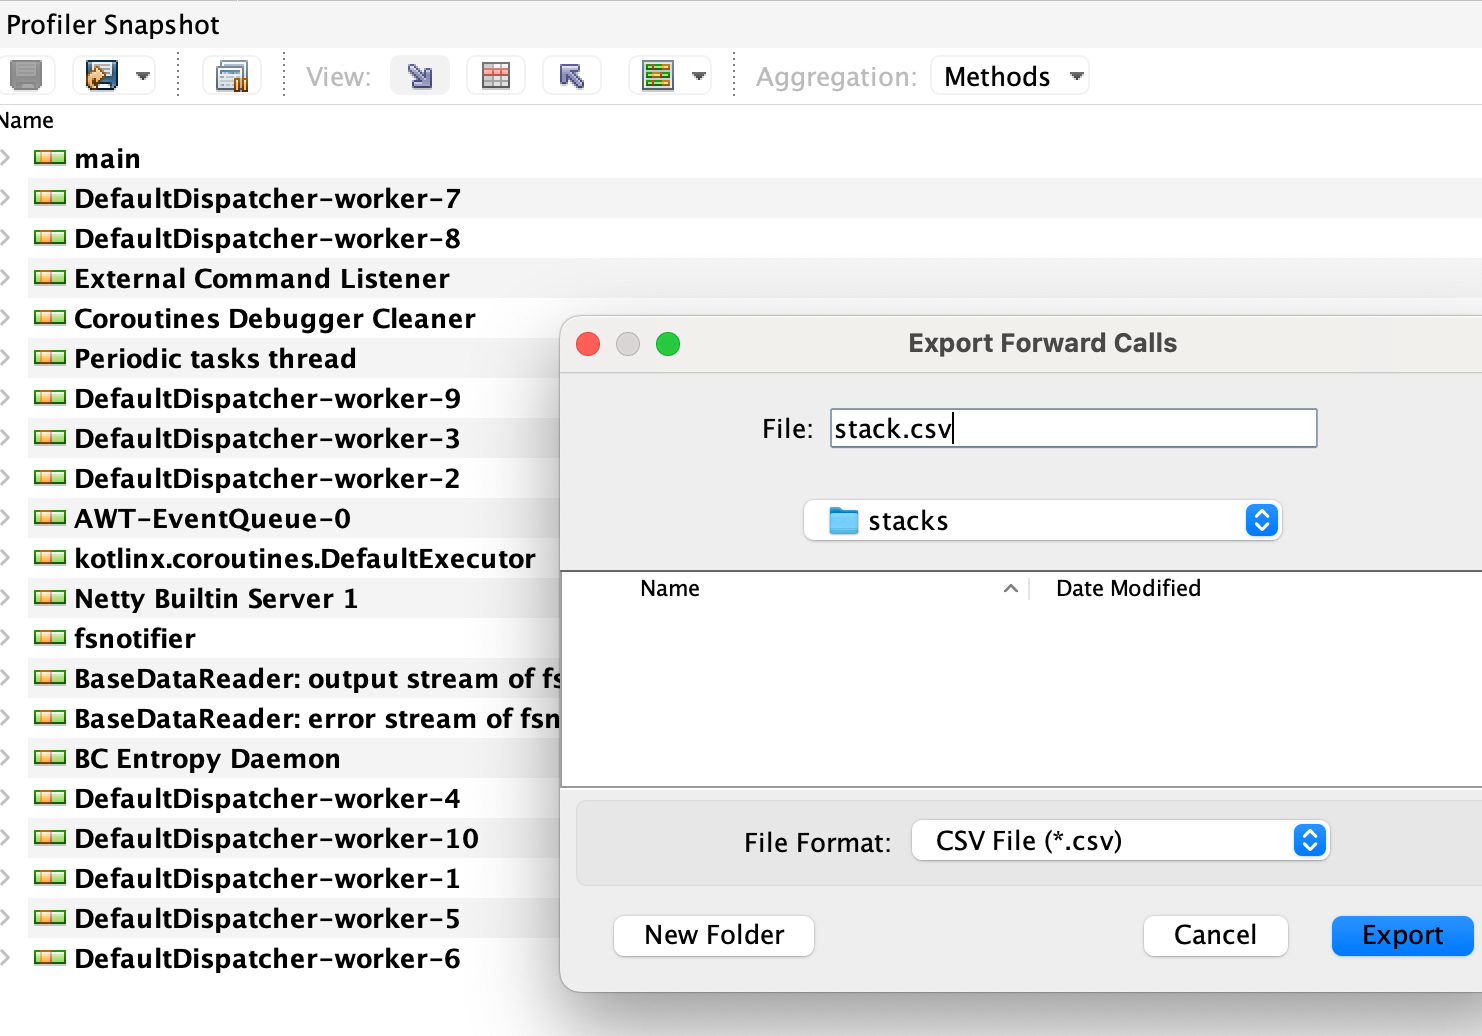
Save as CSV somewhere…

Download and run conversion script
This Python script converts to the flamegraph file format. Download it to the flamegraph repo you cloned. Then run it on the stack you just saved:
$> python parse_stack.py ~/stacks/stack.csv > intellij_stack.txt
Create a flamegraph SVG file
Run the flamegraph script to generate a flamegraph SVG image
$> ./flamegraph.pl intellij_stack.txt > intellij_graph.svg
View the flamegraph…
Now you have a nice flamegraph SVG you can view in your browser! On Mac, with google chrome as the default application for SVGs, you can simply do:
$> open intellij_graph.svg
and explore! Here’s the SVG. Click to get your browser’s full SVG exploration abilities :)
Enjoy softwaredoug in training course form!
Starting Feb 2!
 I hope you join me at Cheat at Search with LLMs to learn how to apply LLMs to search applications. Check out this post for a sneak preview.

