In a previous post, I guess whether a document is relevant for a query in the vmware kaggle competition. This competition provides no relevance judgments. Just the corpus and some queries. This isn’t too dissimilar from my consulting life. I may need to help someone with a corpus, a set of queries, and a desire from the powers that be to just “make it work”. After all who is excited to start a project to extensively label queries?
But how do you handle such a tricky problem? There are, a number of ways we COULD guess labels - from chatGPT labeling, to finding analagous datasets, to seeing what Google thinks of the query.
To solve the problem, I, um… chose the most interesting path for my weekend hacking. I took liberties to reverse engineer those labels from my many failed submissions. Can I turn my own stupidity into an ally?
For each submission I’ve made, I know the mean NDCG@5 of about 2500 queries. By comparing one submission’s ranking to another, I randomly label each result as relevant or not. I then compute a probability of that relevance “universe” given the various submissions NDCG. Accumulating the universe probabilities where a query-doc is a 1 (relevant) vs 0 (irrelevant), I can, over time, arrive at the proportion of likely universes a document was relevant or not.
So, does it work? Presto, chango… sorta.
The final labels are, mostly not that compelling. Except for a few obvious cases, they mostly stay around 0.5. As likely to be relevant as not. Some nudge a bit higher, others nudge a bit lower. Quite a few actually seem to be irrelevant rather than relevance.
They look a bit like this…
Most relevant:
In [3]: simulated_results.sort_values('grade')[['DocumentId', 'Query', 'grade']].tail(10)
| DocumentId | Query | grade | |
|---|---|---|---|
| 43980 | 2961967.txt | how to share folder between vmware and windows 10 | 0.706571 |
| 11550 | en-2021-VMware-Validated-Design-5-1-1-sddc-sec… | sudo vi /etc/hosts | 0.709303 |
| 62430 | https—blogs.vmware.com-customer-experience-a… | how to install vm ware tools | 0.864787 |
| 62434 | https—blogs.vmware.com-kb-2010-02-how-to-ins… | how to install vm ware tools | 0.870307 |
| 62433 | https—blogs.vmware.com-kb-2010-02-how-to-ins… | how to install vm ware tools | 0.876162 |
| 62435 | https—blogs.vmware.com-kb-2010-02-how-to-ins… | how to install vm ware tools | 0.889947 |
| 38940 | https—www.vmware.com-products-hyper-converge… | what is hci hyper converged infrastructure | 0.909118 |
| 62409 | 1014294.txt | how to install vm ware tools | 0.931209 |
| 33855 | https—www.vmware.com-products-hyper-converge… | what is hyper converged infrastructure | 0.941977 |
| 7257 | https—blogs.vmware.com-kb-2010-02-how-to-ins… | how to install vmtools in linux | 0.942623 |
Least relevant:
In [4]: simulated_results.sort_values('grade')[['DocumentId', 'Query', 'grade']].head(10)
| DocumentId | Query | grade | |
|---|---|---|---|
| 0 | 1004351.txt | what is hypervisor | 0.000015 |
| 21699 | en-2021-VMware-Workstation-Pro-16-0-com-vmware… | nsx cdo mode | 0.000015 |
| 21714 | en-2021-VMware-NSX-Data-Center-for-vSphere-6-2… | how to install windows 10 on vmware fusion 11 | 0.000015 |
| 21715 | en-2021-VMware-NSX-T-Data-Center-3-0-administr… | how to install windows 10 on vmware fusion 11 | 0.000015 |
| 21716 | en-2021-VMware-vCloud-Availability-3-0-adminis… | how to install windows 10 on vmware fusion 11 | 0.000015 |
| 21717 | en-2021-VMware-vSphere-7-0-com-vmware-vsphere-… | how to install windows 10 on vmware fusion 11 | 0.000015 |
| 21718 | en-2021-vCloud-Director-8-10-com-vmware-vcloud… | how to install windows 10 on vmware fusion 11 | 0.000015 |
| 56727 | en-2021-vRealize-Suite-2017-com-vmware-vrsuite… | how to fix the system administrator has set po… | 0.000015 |
| 21731 | en-2021-VMware-Horizon-Client-for-Mac-2103-hor… | what is tanzu vmware | 0.000015 |
| 21735 | en-2021-VMware-Workstation-Pro-12-0-com-vmware… | what is tanzu vmware | 0.000015 |
OK. Not that exciting. I tabled this idea for a while… But after Haystack hackdays I had my own idea.
Somewhat inspired by René Kriegler’s hierarchical modeling for clicks, I thought, well no, I don’t have a pure sense of relevance or not at the query-document grain. That, frankly, would be very hard without many many more simulations.
Instead, I COULD, boil these rows down to their constituent features. No I don’t have a sense at such a fine grain of query and document. But, with so many examples (I have about 65k query-doc labels) could I know that’s behind the relevance evaluation? Can I know something about the probability a feature value predicts relevance or not? Is the title similarity more important than the body similarity? Or earlier in the body more important than any location in the body? With this information, I might be able to arrive at a general ranker for the competition.
To play with some features, I extracted the following. For Universal Sentence Encoder (USE) and MPNet (a transformer based model), I’ve encoded different parts of the document I hypothesize relate to relevance. A “line” in the document roughly corresponds to a sentence.
- first_line_sim_* - query similarity of the first line of the body, essentially the title
- max_sim_5_* - max similarity of first 5 lines
- max_sim_10_* - max similarity of first 10 lines
- max_sim_* - max similarity of whole doc
- mean_sim_* - avg of the sismilarity measure (also at 5, 10, or whole doc)
- sum_sim_* - sum of the similarity measure over the document (also at 5, 10, or whole doc)
The code for encoding thes is not groundbreaking, you can check it out here. Just boring use of sentence transformers, with some caching for good measure.
Given each query-doc features, the first thing to do is test correlation
In [6]: from scipy import stats
   ...: corr = []
   ...: for field in cached_fields():
   ...:     corr.append((field, stats.pearsonr(with_scores['grade'], with_scores[field])))
On just a sample of 500 query-doc pairs, the results are compelling:
In [10]: sorted(corr, key=lambda value: value[1].statistic, reverse=True)
Out[10]:
[('max_sim_use',
  PearsonRResult(statistic=0.5147834704176775, pvalue=3.502322240904857e-35)),
 ('max_sim_10_use',
  PearsonRResult(statistic=0.5136431723052645, pvalue=5.220441982771205e-35)),
 ('max_sim_10_mpnet',
  PearsonRResult(statistic=0.503594757354426, pvalue=1.6494138781205577e-33)),
 ('max_sim_5_mpnet',
  PearsonRResult(statistic=0.5020173215309318, pvalue=2.807068832629529e-33)),
 ('max_sim_5_use',
  PearsonRResult(statistic=0.49873269546659493, pvalue=8.418813139962139e-33)),
 ('max_sim_mpnet',
  PearsonRResult(statistic=0.4976839328435423, pvalue=1.1925241731256526e-32)),
 ('first_line_sim_mpnet',
  PearsonRResult(statistic=0.48601478876423587, pvalue=5.298562670972091e-31)),
 ('first_line_sim_use',
  PearsonRResult(statistic=0.4806628327027033, pvalue=2.8768130000112398e-30)),
 ('mean_sim_5_mpnet',
  PearsonRResult(statistic=0.43971260137179036, pvalue=4.692081446586251e-25)),
 ('sum_sim_5_mpnet',
  PearsonRResult(statistic=0.4361527489391774, pvalue=1.2359753133024934e-24)),
 ('sum_sim_10_mpnet',
Wow, the next thought for further exploration, what does a relevant doc look like? What does an irrelevant doc look like?
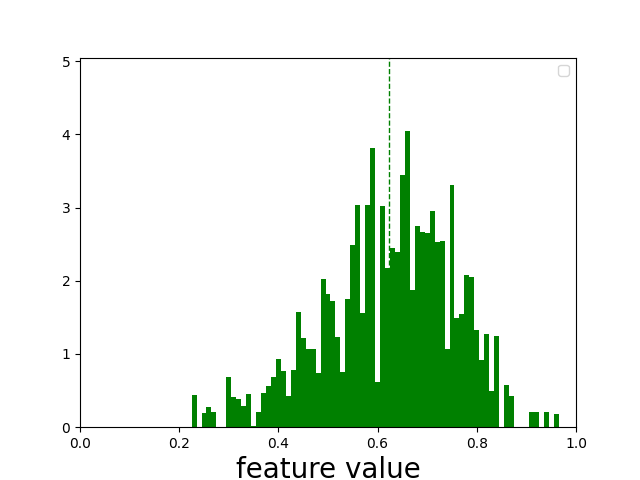
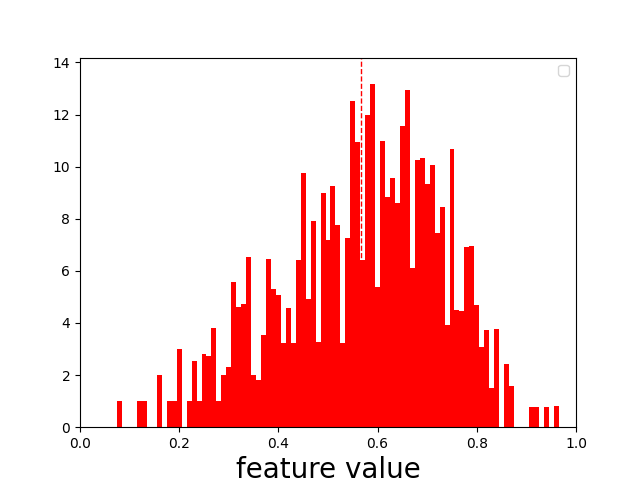
We can create a histogram of a feature over all query-document examples in our dataset. For each example, we can place a bit of this feature into buckets for relevant or irrelevant classes - hist1, hist0 accordingly. If the document has a grade of 0.5, 50% chance its relevant, and 50% chance it’s irrelevant. So if max_sim_use is 0.9, then we assign an equal amount to hist0 and hist1’s 0.9 histogram bucket.
def build_hist(scored_results, field):
    buckets = np.arange(0, 1.01, 0.01)
    assigned_buckets = np.digitize(scored_results[field], buckets)
    hist1 = np.zeros(100)
    hist0 = np.zeros(100)
    for idx, bucket in enumerate(assigned_buckets):
        hist1[bucket] += scored_results['grade'].iloc[idx]
        hist0[bucket] += (1 - scored_results['grade'].iloc[idx])
    return hist0, hist1
The “x” axis or the “buckets” corresponds to the feature value. We just give more or less oomph to that feature value in the corresponding class’s histogram depending on the probability.
Plotting one of our strongest correlating feature, shows a somewhat muddied picture, but still pointing at a rough pattern:
Digging into one of the examples, I found a typical “difficult negative” relevance example. Probably just the kind of example VMWare hopes we can rank correctly in this competition:
Query: “how to install vmware tools on Windows”
Deceptively similar result, but seemingly not actually relevant:
How to install VMware Tools in a Windows virtual machine that is running on VMware Fusion - VMware Support Insider
Yet Google gives [this first result], indicating likely this document isn’t quite what we want:
Manually Install VMware Tools on Windows
You can see how easy for a domain specific corpus to be “tricked” by simple unsupervised measures. Whether just BM25 or a fancy language model, often things look relevant to the statistic, but actually are not.
After all, this is what makes search interesting! To solve relevance we have to get a level deeper than these early features. We need to know in what cases specific features matter. We need to fine-tune to the domain - tackling acronyms and other technical terminology.
That’s just the start of creating a general ranker, what might be next steps?
- Explore more / better features with this dataset that more cleanly separate relevant / irrelevant classes?
- Search what combinations of features better predict the generated ranking - does something correlate even more highly?
- Examine not just the features themselves - but their pairwise difference
- Fine-tune a model on the corpus and re-analyze?
Perhaps given these, I can arrive at a sense for what might actually predict relevance, and arrive at a general ranker based even on these weak labels.
Enjoy softwaredoug in training course form!
Starting May 18!
Signup here - http://maven.com/softwaredoug/cheat-at-search I hope you join me at Cheat at Search with Agents to learn use agents in search. build better RAG and use LLMs in query understanding.

Doug Turnbull
More from DougTwitter | LinkedIn | Newsletter | Bsky